Multiple Choice
Refer to the graph shown. The line segment that represents average variable costs of producing Q* is: 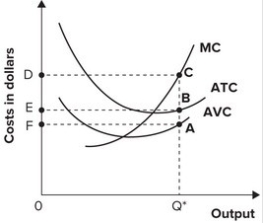
A) AQ*.
B) BQ*.
C) CQ*.
D) AB.
Correct Answer:

Verified
Correct Answer:
Verified
Related Questions
Q8: The vertical distance between the average total
Q25: Why does the marginal cost curve always
Q28: Variable costs:<br>A) do not exist in the
Q45: Explicit revenue minus explicit measurable costs equals:<br>A)
Q57: The average fixed cost curve is:<br>A) U-shaped.<br>B)
Q124: The diagram was intended to illustrate the
Q125: Refer to the table shown. The
Q128: If marginal cost is less than average
Q131: Refer to the table shown. The
Q137: Which of the following costs is independent