Multiple Choice
Refer to the graph shown. Total fixed cost of producing Q* is represented by: 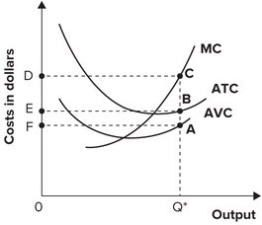
A) area 0Q*AF.
B) area ABEF.
C) area ACDF.
D) cannot be determined.
Correct Answer:

Verified
Correct Answer:
Verified
Related Questions
Q15: If your latest test grade and your
Q34: In the short run:<br>A) all inputs are
Q49: The marginal cost curve intersects the:<br>A) total
Q55: The typical average variable cost curve:<br>A) is
Q81: Other things being equal, when average productivity
Q115: When output is 50, fixed costs are
Q147: To make sure that you understand
Q148: Refer to the table shown. The
Q150: Congratulations! You have just been promoted
Q152: Refer to the table shown. The