Multiple Choice
Refer to the graph shown. When price rises by 10 percent, quantity supplied rises by 10 percent. Which curve best demonstrates the elasticity of supply in this example? 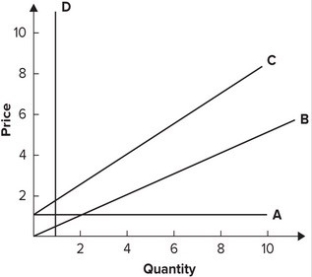
A) A
B) B
C) C
D) D
Correct Answer:

Verified
Correct Answer:
Verified
Related Questions
Q1: As the manager of a ski resort,
Q7: It is estimated that a 5 percent
Q25: Measuring the price of gasoline in dollars,
Q34: If macaroni and cheese is an inferior
Q63: If demand is highly inelastic and supply
Q81: Refer to the table shown to
Q84: Refer to the table shown to
Q85: Consider the following three diagrams: <img src="https://d2lvgg3v3hfg70.cloudfront.net/TB7143/.jpg"
Q88: Refer to the graph shown. At which
Q113: If the price elasticity of demand for