Multiple Choice
Refer to the graph shown. When price declines by 11 percent, quantity supplied falls by 8 percent. Which curve best demonstrates the elasticity in this example? 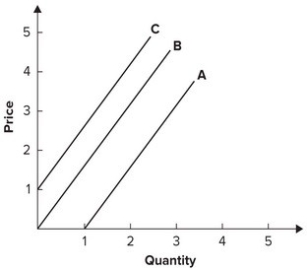
A) A
B) B
C) C
D) None of the answers is correct.
Correct Answer:

Verified
Correct Answer:
Verified
Related Questions
Q12: Five brief scenarios are presented below. Apply
Q14: Cross-price elasticity of demand is defined as
Q14: Refer to the graph shown. At point
Q18: Refer to the graph shown. Which of
Q20: The supply of Russian caviar from the
Q23: Along a straight-line supply curve:<br>A) elasticity rises
Q24: Refer to the graph shown. Which supply
Q38: The price elasticity of supply is the:<br>A)
Q64: Along a straight-line demand curve, elasticity:<br>A) rises
Q103: The short-run elasticity of demand for gasoline