Multiple Choice
Refer to the following graphs. 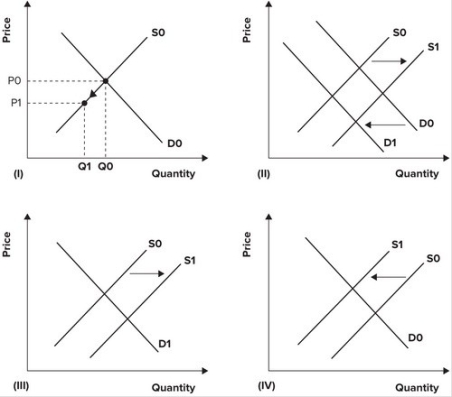 Floods in the U.S. Midwest reduce the U.S. corn crop. Which graph depicts the effect of the floods on the U.S. corn market?
A) I
B) II
C) III
D) IV
Correct Answer:

Verified
Correct Answer:
Verified
Related Questions
Q4: Start by drawing a supply and demand
Q24: Americans over the age of 65 are
Q55: Suppose that there is a renewed interest
Q74: A decrease in quantity and price is
Q76: The U.S. Postal Service printed 150,000 sheets
Q90: When computer manufacturers overcame the enormous 13,000
Q105: An increase in price and decrease in
Q109: Suppose that the market labor supply and
Q118: An effective price ceiling is best defined
Q133: Which price ceiling will cause the greatest