Multiple Choice
Refer to the following graphs. 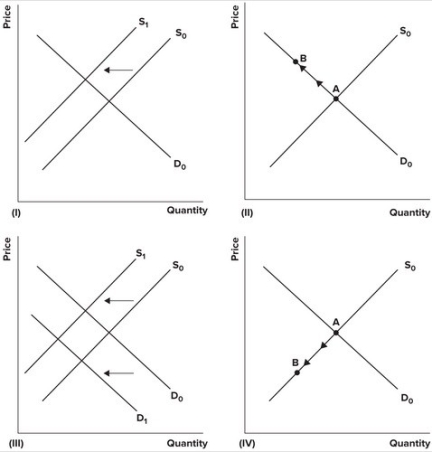 A recent report indicated that 50 intensive-care unit patients die for every 1,000 who are managed with a heart device known as the right heart catheter. Suppose as a result, the FDA limited supply of the heart catheters. The effect of the report and subsequent action by the FDA on the market for right heart catheters is best shown by which of the graphs?
A) I
B) II
C) III
D) IV
Correct Answer:

Verified
Correct Answer:
Verified
Q8: Explain the shifts in demand and/or supply
Q11: Use a supply/demand diagram to explain the
Q20: What events most likely explain the following
Q48: Given the equations for demand and supply:
Q49: When an effective price ceiling is removed,
Q63: Suppose that a consumer has a health
Q64: A Wall Street Journal headline reads: "Cigar
Q67: Refer to the following graph. <img src="https://d2lvgg3v3hfg70.cloudfront.net/TB7143/.jpg"
Q70: Refer to the following graph. <img src="https://d2lvgg3v3hfg70.cloudfront.net/TB7143/.jpg"
Q75: Season tickets to the Miami Heat games