Multiple Choice
Refer to the following graphs. 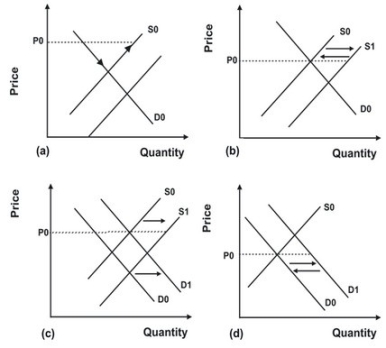 In the early 1990s, mounds of newspapers and worthless plastic piled up at recycling centers. As the nation's economy continued to grow, increased demand eliminated the mounds and turned them into shortages. In the mid-1990s, as recycling became more popular, the mounds of recycled materials returned. What graph best depicts these events on the market for recycled materials?
A) Price remained constant at P0. Quantity demanded first rose, while supply remained constant; quantity supplied then rose, while demand remained constant.
B) Price remained constant at P0. Supply first shifted from S1 to S0 and then back to S1.
C) Price remained constant at P0. Demand shifted from D0 to D1 then supply shifted from S0 to S1.
D) Price remained constant at P0. Demand shifted from D0 to D1 and then back to D0.
Correct Answer:

Verified
Correct Answer:
Verified
Q10: The market for tennis racquets in a
Q14: A decrease in price and an indeterminate
Q14: In the 1990s and into the fist
Q19: What is a third-party payer market? Give
Q21: What is a price ceiling? What is
Q46: Refer to the graph shown. With a
Q47: Refer to the table shown that
Q80: When the person who chooses how much
Q123: Tariffs increase equilibrium price and quantity.
Q134: Suppose that initially, supply is given by