Multiple Choice
Refer to the graph shown. Given supply, S0, and demand, D, what tariff would the government have to impose on lumber imported from Canada to reduce imports to 600 tons? 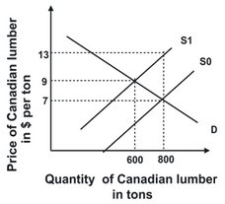
A) $2 a ton
B) $7 a ton
C) $13 a ton
D) $6 a ton
Correct Answer:

Verified
Correct Answer:
Verified
Q7: Refer to the graph shown. If consumers
Q9: Refer to the table shown that
Q9: Demonstrate graphically and explain verbally the impact
Q12: Refer to the following graph. <img src="https://d2lvgg3v3hfg70.cloudfront.net/TB7143/.jpg"
Q50: Real-world experience shows that when weather conditions
Q71: Suppose a recent and widely circulated medical
Q82: Suppose that initially, the equations for demand
Q97: The Rent Control Authority of Chicago has
Q104: European Union subsidizes its farmers. How do
Q132: Suppose that the free market labor supply