Multiple Choice
Refer to the graph shown that depicts a third-party payer market for prescription drugs. What happens to total expenditures in this market if a $2 co-pay is established compared to a free-market equilibrium? 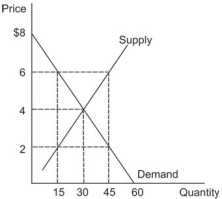
A) Expenditures rise to $240
B) Expenditures rise to $270
C) Expenditures fall by $120
D) Expenditures remain at $120
Correct Answer:

Verified
Correct Answer:
Verified
Q4: Start by drawing a supply and demand
Q18: What is a price floor? What happens
Q57: A tariff is:<br>A) a tax that government
Q74: A decrease in quantity and price is
Q90: When computer manufacturers overcame the enormous 13,000
Q100: In 1990 the UN placed trade sanctions
Q101: When a hurricane destroys a significant portion
Q114: Online music stores such as Apple's iTunes
Q118: An effective price ceiling is best defined
Q145: Refer to the following graph. <img src="https://d2lvgg3v3hfg70.cloudfront.net/TB7143/.jpg"