Essay
Consider the following diagram 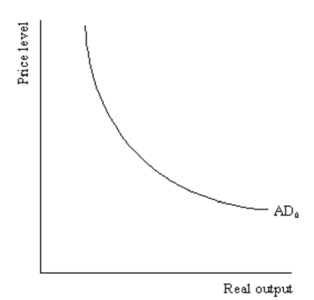 Demonstrate graphically and explain verbally the impact of a decrease of 50 in government spending on the AD curve in the diagram when the multiplier is 3.
Correct Answer:

Verified
The total impact of the decrease of 50 o...View Answer
Unlock this answer now
Get Access to more Verified Answers free of charge
Correct Answer:
Verified
View Answer
Unlock this answer now
Get Access to more Verified Answers free of charge
Q1: Why is the short-run aggregate supply (SAS)curve
Q8: Demonstrate graphically and explain verbally a recessionary
Q36: Explain verbally and demonstrate graphically how in
Q53: What are the three ways that falling
Q57: Imagine you are the chief economist on
Q124: What does aggregate demand management mean?
Q126: Describe two distinct and opposing effects that
Q139: Demonstrate graphically and explain verbally the case
Q164: Explain why the long-run aggregate supply (LAS)curve
Q172: What is deflation? What could deflation do