Multiple Choice
Which graph shows data that are more suitable for regression analysis? 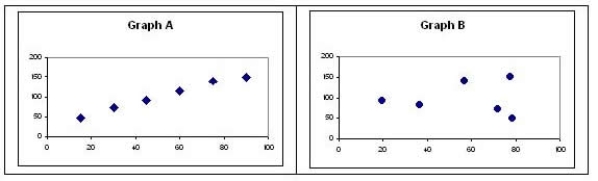
A) Graph A
B) Graph B
C) Neither Graph A nor Graph B
D) Cannot be determined
Correct Answer:

Verified
Correct Answer:
Verified
Related Questions
Q44: Which of the following are forms of
Q45: When estimating future costs it is necessary
Q46: Average costs incorrectly treat fixed costs as
Q47: When estimating future costs, information quality is
Q48: Simple regression estimates an equation that minimises
Q50: Most organisations ignore mixed costs because it
Q51: The incremental cost of an activity is
Q52: Regression analysis overcomes the deficiency in two
Q53: The major disadvantage of the high-low method
Q54: In regression analysis the estimated fixed cost