Multiple Choice
(Figure: Determining Aggregate Equilibrium Levels) 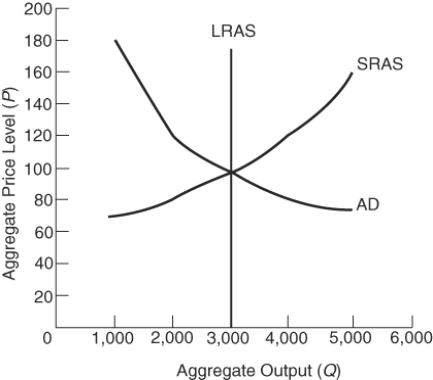 Equilibrium output is _____ units and the equilibrium price level is _____.
A) 2,000; $130
B) 5,000; $160
C) 3,000; $100
D) 100; $3,000
Correct Answer:

Verified
Correct Answer:
Verified
Q52: The long-run aggregate supply curve is vertical
Q167: Which of the following provides an accurate
Q168: The aggregate demand curve has the price
Q171: A(n) _ in government spending, a _
Q172: (Figure: Determining SRAS Shifts 3) <img src="https://d2lvgg3v3hfg70.cloudfront.net/TB7132/.jpg"
Q173: Which of the following sets of events
Q175: The U.S. price level rose more than
Q184: The aggregate demand curve displays<br>A) real GDP
Q237: Increased productivity causes the aggregate supply curve
Q277: Increased taxes will shift the aggregate demand