Multiple Choice
(Figure: Simple Keynesian Model) Based on the figure above, which of the following graphs would best represent the associated saving-investment? 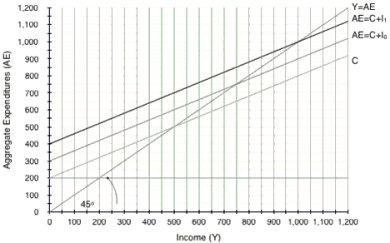
A) 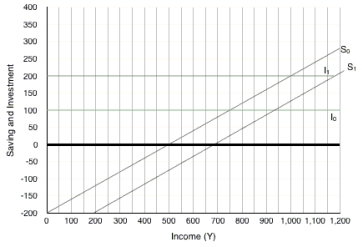
B) 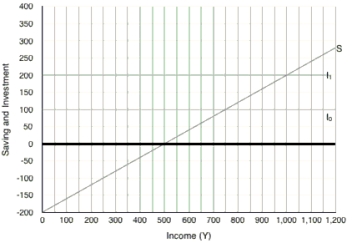
C) 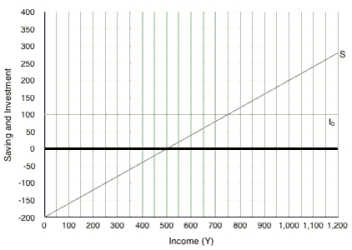
D) 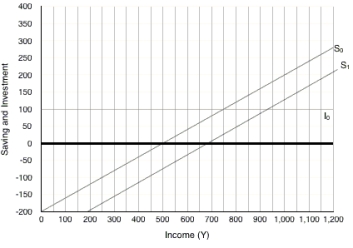
Correct Answer:

Verified
Correct Answer:
Verified
Related Questions
Q23: When the costs of operating machinery rise,
Q49: Changes in government spending and changes in
Q56: In the simple Keynesian model of the
Q57: Suppose economists observe that an increase in
Q59: Which of the following statements about the
Q60: In the simple Keynesian model with no
Q62: Approximately what share of U.S. GDP is
Q63: When household debt levels rise:<br>A) the ability
Q223: If autonomous investment spending falls by $1,000
Q225: The Keynesian conclusion that total injections equal