Multiple Choice
In the graph, an increase in quantity demanded would be represented by a change from point a to point _____, while a decrease in demand would be represented by a change from point d to point _____. 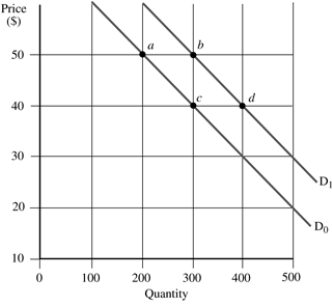
A) b; b
B) b; c
C) c; b
D) c; c
Correct Answer:

Verified
Correct Answer:
Verified
Related Questions
Q15: (Table) Using the data for the
Q18: Amit is willing to pay $330 for
Q19: When the supply curve shifts out (to
Q21: Which statement is a CORRECT description of
Q24: If the quantity demanded is greater than
Q25: Taxes and subsidies, and prices of other
Q226: Willingness-to-pay is the maximum amount one would
Q265: Long-term shortages and surpluses are almost always
Q318: If sellers expect the price of their
Q335: The market economy is often called the