Multiple Choice
(Figure: Determining Curves) The curve in the graph represents a: 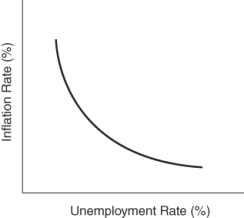
A) demand curve.
B) Phillips curve.
C) labor demand curve.
D) production possibilities curve.
Correct Answer:

Verified
Correct Answer:
Verified
Related Questions
Q23: The Phillips curve<br>A) was developed by economists
Q81: Monetized debt is paid for by:<br>A) a
Q85: Which of these was NOT a response
Q86: Suppose the economy is currently in equilibrium,
Q88: (Figure: Understanding Phillips Curves) What is the
Q89: (Figure: Determining Long-Run and Short-Run Economic Shifts)
Q194: Deflation is a problem because it requires
Q234: One cannot understand the debt obligations stemming
Q240: Which company did the Federal Reserve and
Q258: Monetizing debt results in the depreciation of