Multiple Choice
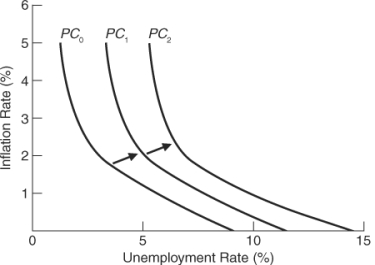
(Figure: Understanding Economic Shifts) The graph depicts: 
A) an expansion.
B) decreasing unemployment rates.
C) stagflation.
D) deflation.
Correct Answer:

Verified
Correct Answer:
Verified
Related Questions
Q16: If wages increase 4% faster than productivity,
Q26: If the economy is in a jobless
Q29: Monetizing the debt intensifies the burden of
Q32: Which of these is(are) true? I. The
Q38: Which of these is(are) true? I. People
Q112: The graph that shows the tradeoff between
Q120: The natural rate of unemployment occurs when
Q159: Adaptive expectations are driven by emotions.
Q175: If policymakers use expansionary measures to reduce
Q248: One implication of the long-run Phillips curve