Multiple Choice
(Figure: Weight Loss and Exercise Time) According to the data in the graph, where weight loss is shown on the y axis, every 2 extra hours of exercise: 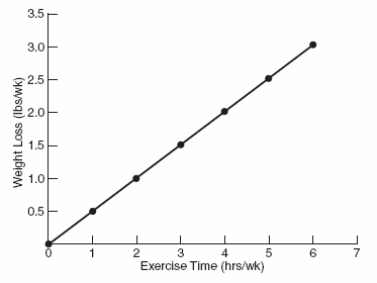
A) increases weight by 1 pound.
B) decreases weight by 1/2 pound.
C) decreases weight by 1 pound.
D) increases weight by 1/2 pound.
Correct Answer:

Verified
Correct Answer:
Verified
Q67: Which statement is a key idea in
Q72: Consider the equation Y = e +
Q111: Economists use graphs because<br>A) they represent relationships
Q230: The observation that highly productive countries have
Q242: Normative questions involve societal beliefs on what
Q264: Which policy is MOST likely to contribute
Q266: Which situation(s) may require government intervention? I.
Q267: If temperature and ice cream sales are
Q270: Which question would be considered a normative
Q293: There would be no economic problems in