Multiple Choice
(Figure: Graph Interpretation) In the graph, the equation for the line is: 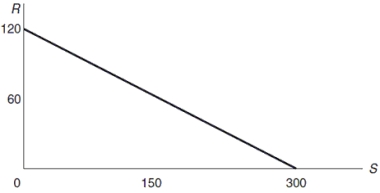
A) R = 120 - 0.4S.
B) R = 120 - 300S.
C) R = 120 + 0.4S.
D) S = 300 + 120R.
Correct Answer:

Verified
Correct Answer:
Verified
Related Questions
Q100: The purpose of an economic model is
Q198: An increase in the price of gold
Q230: Which statement is NOT true?<br>A) There are
Q233: Private markets will typically maximize production efficiency
Q235: Which statement is TRUE?<br>A) Low productivity and
Q236: Which situation deals more with equity than
Q271: Government intervention in the market is helpful
Q308: If two variables are correlated with one
Q312: Thinking at the margin involves<br>A) influencing how
Q323: The _ the opportunity cost of an