Multiple Choice
Which value of Pearson r is closest to what you would expect to find given the curvilinear pattern of data that is displayed below? 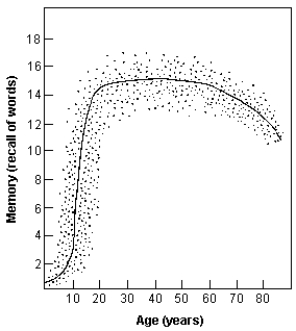
A) -1
B) -.75
C) 0
D) 1
Correct Answer:

Verified
Correct Answer:
Verified
Related Questions
Q11: How many cells are in a contingency
Q12: A crucial assumption underlying the cross-lagged-panel correlation
Q13: Which conditions below should be expected to
Q14: Which of the following represents an example
Q15: Because there is a documented negative correlation
Q17: Which variable are you most likely to
Q18: The typical correlation coefficient varies from:<br>A) 0
Q19: Which interpretation of a zero correlation is
Q20: Which assertion represents an ultimate cause?<br>A) Memory
Q21: Which of the following is an example