Multiple Choice
The plotted series in the following graph is an example of a: 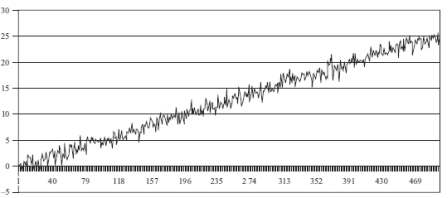
A) Stationary process
B) Deterministic trend process
C) White noise prices
D) Random walk with drift
Correct Answer:

Verified
Correct Answer:
Verified
Related Questions
Q1: Assume that you are trying to model
Q2: Consider the following matrix: <sub> </sub> <img
Q4: Which one of the following best describes
Q5: To induce stationarity in a deterministic trend-stationary
Q6: Which criticism of Dickey-Fuller (DF) -type tests
Q7: Which of the following are problems associated
Q8: Consider the following vector error correction
Q9: If there are three variables that are
Q10: Which of these is a characteristic of
Q11: Consider the testing of hypotheses concerning the