Multiple Choice
A) 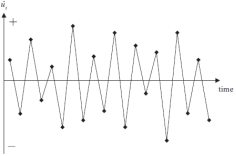 B)
B) 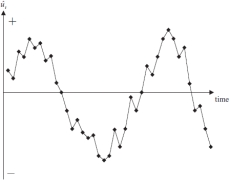
-The graphs above are time series plots of residuals from two separate regressions. Which of these combinations is true?
A) A shows negative autocorrelation and B shows positive autocorrelation
B) A shows positive autocorrelation and B shows negative autocorrelation
C) A shows heteroscasticity and B shows homoscedasticity
D) A shows homoscedasticity and B shows heteroscasticity
Correct Answer:

Verified
Correct Answer:
Verified
Q11: Which of the following conditions must be
Q12: Which of the following would probably NOT
Q13: What is the long run solution
Q14: Which of the following would NOT be
Q15: The assumption of homoscedasticity can be written
Q17: Assuming you are interested in conducting a
Q18: Which of these is not a viable
Q19: If the residuals of a regression on
Q20: If the residuals of a model containing
Q21: Which of these is a test for