Multiple Choice
Consider the following two graphs:
A.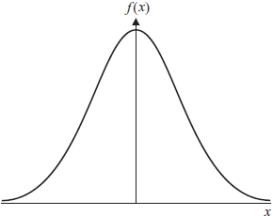 B.
B.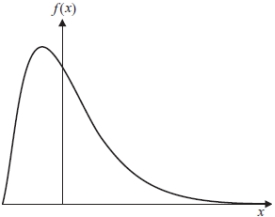 Which of the following statements is true if A represents a normal distribution?
(I) The skewness of the distribution plot A is 0 and its kurtosis is 3
(II) The skewness of the distribution plot B is 0 and its kurtosis is 3
(III) The excess kurtosis of the distribution plot A is 3
(IV) The excess kurtosis of the distribution plot B is 0
A) Both (I) and (III) are true
B) Only (III) is true
C) Only (I) is true
D) Both (I) and (IV) are true
Correct Answer:

Verified
Correct Answer:
Verified
Q7: Consider the following graphs. <br>A.<img src="https://d2lvgg3v3hfg70.cloudfront.net/TB7071/.jpg" alt="Consider
Q8: What is the inverse of matrix ?
Q9: Consider the following data series: 11, 10,
Q10: Assume that the relationship between a company's
Q11: What are the roots of the equation
Q13: Which of the following values are closes
Q14: What are the roots of the equation
Q15: If A is of dimension 1 *
Q16: What is the (first order) derivative of
Q17: The derivative of e<sup>4</sup><sup>x</sup><sup>-2</sup> is:<br>A) 4/(4x-2)<br>B) (4x-2)e<sup>4</sup><br>C)