Not Answered
Below you see graphs that depict the change in frequency of a neutral allele in four populations that differ in size. Which population would you predict is the smallest? 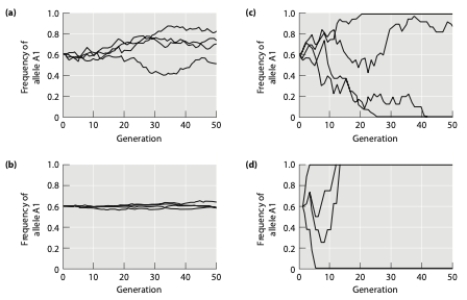
Correct Answer:

Verified
Correct Answer:
Verified
Related Questions
Q37: Considering the principles of mutation, natural selection,
Q38: Inbreeding results in a higher frequency of
Q39: The graph below depicts the change in
Q40: Which of the following would likely increase
Q41: You are studying a population of 100
Q43: Genetic drift<br>A) reduces genetic variation within a
Q44: In which of the scenarios below is
Q45: Many plant species are hermaphroditic and run
Q46: Inbreeding<br>A) changes allele frequencies in a population.<br>B)
Q47: Tasmanian devils once inhabited most of present-day