Not Answered
The graph below depicts the rise in resistance to warfarin in a rat population. Notice that after reaching a peak of 100% resistance, resistance in the population declined. Please provide a plausible evolutionary explanation for this. 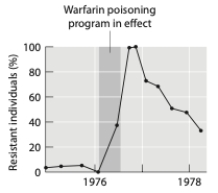
Correct Answer:

Verified
Correct Answer:
Verified
Q4: The probability of an allele being lost
Q5: The graphs below show the results of
Q6: A mosquito that has the genotype Ester<sup>1</sup>Ester<sup>1</sup>
Q7: The sickle-cell anemia allele, S, experiences strong
Q8: Inbreeding<br>A) increases heterozygosity in populations.<br>B) creates deleterious
Q10: A bowl of beads has 500 red
Q11: Which of the following is the best
Q12: If a population is in Hardy-Weinberg equilibrium
Q13: Although the Ester<sup>1</sup> allele confers a selective
Q14: An example of a phenotype is _,