Multiple Choice
The figure below shows the amount of time it takes pigeons in groups of varying size to respond to a potential predator. Based on this graph, pigeons experience what benefit from grouping? 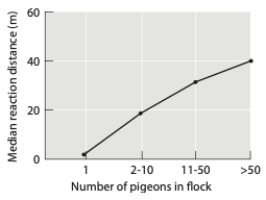
A) increased vigilance
B) dilution
C) group defense
D) cooperative foraging
E) There is no benefit.
Correct Answer:

Verified
Correct Answer:
Verified
Q35: How might a behavior affect fitness?<br>A) A
Q36: Why is it important to avoid anthropomorphism?<br>A)
Q37: Which of the following statements is not
Q38: How do mountain laurels, Kalmia latifolia, behave
Q39: What do sensory maps of the human
Q41: What type of selection permits the coexistence
Q42: Explain how the vertebrate brain can reflect
Q43: What is the coefficient of relatedness of
Q44: Which of the following of Nikolaas Tinbergen's
Q45: Why is haplodiploidy thought to predispose hymenopteran