Multiple Choice
The figure below shows the number of predatory attacks per individual in water skater groups of different sizes. The information in the graph demonstrates which benefit of grouping? 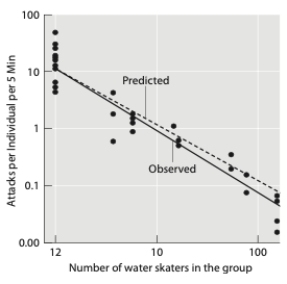
A) increased vigilance
B) dilution
C) group defense
D) cooperative foraging
E) There is no benefit.
Correct Answer:

Verified
Correct Answer:
Verified
Q14: A behavior can evolve through natural selection
Q15: Which of the following is an example
Q16: Which of the following is not an
Q17: Certain animals can communicate in ways that
Q18: Which of the following is an example
Q20: What do(es) the following figures suggest about
Q21: In the paper wasp, although all females
Q22: What evidence does not support the hypothesis
Q23: When population density is high and food
Q24: How does a Venus flytrap respond to