Multiple Choice
Examine the following Q-Q plot from the pre-test control group. What can be assumed from the graph? 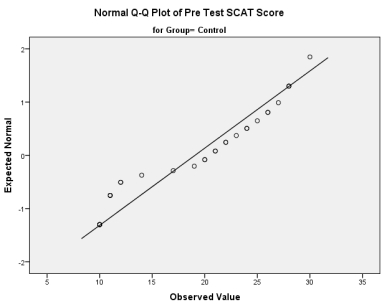
A) Data may not be normally distributed because the points deviate from the diagonal line.
B) Data are definitely not normally distributed because the points deviate from the diagonal line.
C) Data may be normally distributed because the points deviate from the diagonal line.
D) Data are definitely normally distributed because the points deviate from the diagonal line.
Correct Answer:

Verified
Correct Answer:
Verified
Q3: Which test can be considered the non-parametric
Q14: Which of the following are non-parametric tests?<br>A)
Q19: When using non-parametric tests, which measure of
Q22: If we wanted to compare the control
Q23: Suppose you were interested in the longer-term
Q30: Examine the following Q-Q plot from the
Q38: Based on the answer to Q13, what
Q40: Run an appropriate test between the pre-test
Q41: Based on the results of the initial
Q45: Which is the correct expression for the