Multiple Choice
Researchers were interested in finding out how the respiratory parameters in a group of individuals who were diagnosed with asthma responded to a six-week aerobic training intervention. Forced expired ratio (FER, %) is the product of the forced expired ratio in 1 second (FEV1, litres) divided by the forced vital capacity (FVC, litres) and was the parameter the researchers were most interested in. The results are presented below. Enter the data into SPSS and plot a bar chart representing the mean of the pre- and post-test data. Add the 95% confidence intervals for the mean. You should get the bar chart shown below. What does the 95% confidence interval (CI) that you have plotted refer to? 
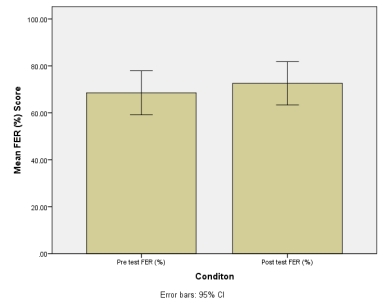
A) 95% confidence that the mean will fall between these intervals
B) 95% confidence that all data points fall between these intervals
C) 95% confidence that all data points fall outside these intervals
D) 95% confidence that the range falls between these intervals
Correct Answer:

Verified
Correct Answer:
Verified
Q1: A histogram is most closely related to
Q3: Twenty-five percentile points is commonly referred to
Q5: Describe the appearance of the line of
Q7: Plot the FEV<sub>1</sub> data presented in Q11
Q7: Which measure of central tendency is presented
Q8: Which axis is the dependent variable usually
Q9: Analyse the following box-whisker plot. What assumptions
Q9: Calculate the mean and standard deviation of
Q13: Normally distributed data are normally referred to
Q17: If you were to graphically present the