Multiple Choice
What does the graph below indicate about the normality of our data? 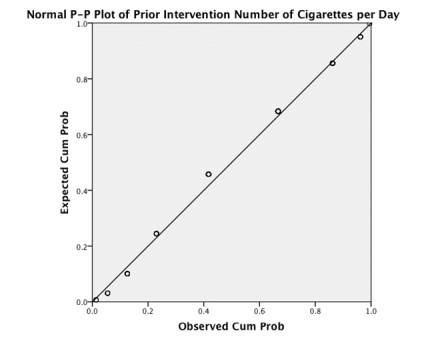
A) We cannot infer anything about the normality of our data from this type of graph.
B) The P-P plot reveals that the data deviate mildly from normal.
C) The P-P plot reveals that the data are normal.
D) The P-P plot reveals that the data deviate substantially from normal.
Correct Answer:

Verified
Correct Answer:
Verified
Q1: A kurtosis value of -2.89 indicates:<br>A)There is
Q9: The Kolmogorov-Smirnov test can be used to
Q14: 15,467 people rated how much they liked
Q15: A confidence interval (and p-value) associated with
Q17: Which of the following is not a
Q20: Imagine you conduct a t-test using IBM
Q24: A _ is a numerical characteristic of
Q27: Which of the following is not an
Q32: When it is not necessary to use
Q32: Looking at the table below,which of the