Multiple Choice
What does the graph below indicate about the normality of our data? 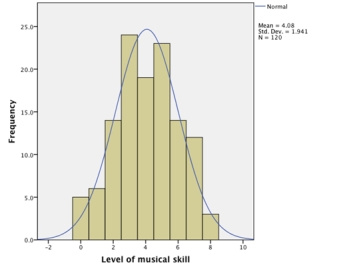
A) The histogram reveals that the data have multivariate normality.
B) We cannot infer anything about the normality of our data from this graph.
C) The histogram reveals that the data are more or less normal.
D) The histogram reveals that the data deviate substantially from normal.
Correct Answer:

Verified
Correct Answer:
Verified
Q5: Which of the following symbols does
Q8: Levene's test can be used to measure:<br>A)Whether
Q10: What does the assumption of independence mean?<br>A)This
Q10: Looking at the table below,which of the
Q12: Should you use significance tests of skew
Q13: Which of the following transformations is most
Q13: A researcher investigating 'Pygmalion in the classroom'
Q19: A standard score is:<br>A)A z-score<br>B)The standard deviation
Q23: In a small data sample (N =
Q28: The assumption of homogeneity of variance is