Multiple Choice
The histogram shown below relates to a study undertaken by Baker et al. (2003) of the impact of roster changes on absenteeism and incident frequency in an Australian coal mine. The average monthly absenteeism rates in the three specific work areas examined, according to collection period. The authors state that 'there was a trend for increased rates during the second (3.11%) and third (3.72%) collection periods within the CPP sector, compared to the first (1.87%) , F(2,24) = 2.441, p > 0.05.' What does this result explain? 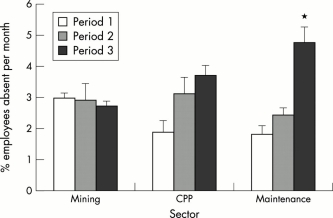 Source: http:/ / oem.bmj.com/ content/ vol60/ issue1/ images/ large/ om01240.f3.jpeg
A) Maintenance in period 3 was significant.
B) The trends were not significant.
C) Sector in period 1 was least significant.
D) The trends were significant.
Correct Answer:

Verified
Correct Answer:
Verified
Q1: Using the data in the table below,
Q1: How many dependent variables does a two-way
Q4: An experiment was done to look at
Q5: Using the data in the table below,
Q6: A study undertaken by an unknown author
Q14: In a factorial design with two factors,
Q18: If a study has employed a two-way
Q20: Which of the following is a key
Q24: Which of the following is not an
Q25: When cell means for subgroups are examined,