Multiple Choice
Consider the graph below. This is the graph of the results of an experimental learning condition as the independent variable and IQ as the covariate. What does the graph indicate? 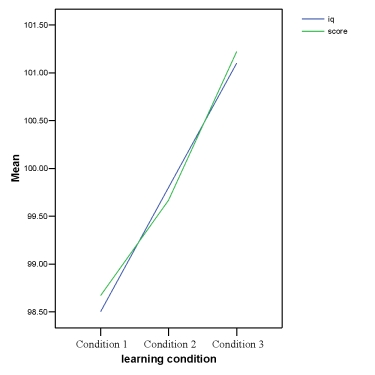
A) Although the independent variable has had an effect on the dependent variable, the covariate is the more likely explanation of effect.
B) The learning condition has altered IQ.
C) IQ has altered the learning condition.
D) Not enough information.
Correct Answer:

Verified
Correct Answer:
Verified
Q2: A music teacher had noticed that some
Q8: A scatterplot and a summary table for
Q9: What is not true of the ANCOVA
Q10: A music teacher had noticed that some
Q10: What assumption does ANCOVA have that ANOVA
Q13: In an ANCOVA with one covariate and
Q15: What is an alternative way to model
Q15: A music teacher had noticed that some
Q16: The following scatterplot represents the results of
Q20: What does the effect size measure in