Multiple Choice
What does the relationship of the data in the following scatterplot indicate? 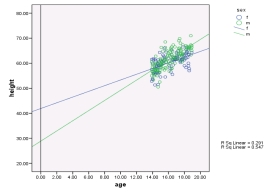
A) A positive relationship where height increases with age for both sexes
B) A larger relationship for males
C) A negative relationship for both sexes
D) None of the above
Correct Answer:

Verified
Correct Answer:
Verified
Related Questions
Q2: A music teacher had noticed that some
Q3: To 'partial out' means to?<br>A) Examine the
Q7: What makes ANCOVA different from ANOVA?<br>A) ANCOVA
Q10: When assumptions are violated in ANCOVA, which
Q10: What assumption does ANCOVA have that ANOVA
Q11: A health psychologist was interested in the
Q13: In an ANCOVA with one covariate and
Q15: A music teacher had noticed that some
Q16: The following scatterplot represents the results of
Q17: What does ANCOVA allow the researcher to