Multiple Choice
The following figure illustrates a proton gradient.In this figure, protons are indicated by small circles.Which part of the figure has the lower pH? 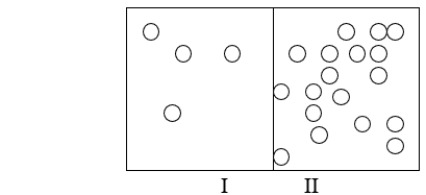
A) part I because it has a lower concentration of protons
B) part II because it has a lower concentration of protons
C) part I because it has a higher concentration of protons
D) part II because it has a higher concentration of protons
E) They both have the same pH because pH has nothing to do with protons.
Correct Answer:

Verified
Correct Answer:
Verified
Q26: Even though there are more protons in
Q27: How many carbons are removed from a
Q28: Which of the following pathways results in
Q29: The net result of glycolysis is an
Q30: What type of reaction occurs during the
Q32: Which statement BEST summarizes the first stage
Q33: What is the last stage of metabolism
Q34: Where does ATP synthase get the energy
Q35: Which of the following choices is NOT
Q36: Which statement about glycolysis is FALSE?<br>A) Glycolysis