Multiple Choice
The bar graph below shows the percentage of saturated fats in a variety of triacylglycerols.Given this information, which triacylglycerols should be minimized in the diet? 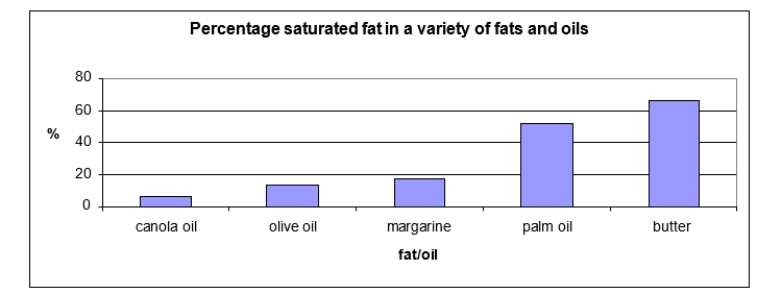
A) canola oil
B) butter
C) canola oil, olive oil, and margarine
D) margarine
E) palm oil and butter
Correct Answer:

Verified
Correct Answer:
Verified
Q92: The component of the cell membrane labeled
Q93: Match the type of fatty acid with
Q94: How does a double bond in a
Q95: The component of a cell membrane shown
Q96: Triacylglycerols generally have physical properties<br>A) similar to
Q98: Identify the class of lipid to which
Q99: Fatty acids are stored in _ and
Q100: Anti-asthma medications are _ inhibitors, whereas nonsteroidal
Q101: Which of the fatty acids shown below
Q102: The melting point of a fatty acid