Multiple Choice
The accompanying graph shows a growth curve of E.coli growing in a defined medium containing equal molar amounts of glucose and lactose. 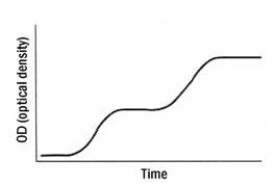 Based on your knowledge of the regulation of the lac operon,the best explanation of these results is that
A) early on,due to the presence of lactose,the bacteria use the lac operon.Glucose is used later.
B) the bacteria use both sugars simultaneously.
C) the presence of glucose causes the formation of cAMP catabolic repressor protein (CRP) complexes,which shut down the lac operon until the glucose is used up.
D) glucose is used first.Once glucose becomes limiting,intracellular cAMP increases,forming cAMP-CRP complexes that activate the lac operon to use lactose.
E) early on the glucose binds to the repressor protein lacI and shuts down the lac operon.
Correct Answer:

Verified
Correct Answer:
Verified
Q1: You are examining an enzyme associated with
Q3: What is the difference between trans- and
Q4: The chromosome of a bacterial cell possesses
Q5: The nucleus of a differentiated cell contains
Q6: Within a genome,an enhancer may be located<br>A)upstream
Q7: A lac <sup>I−</sup><sup> </sup>mutant would<br>A)express lacZYA constitutively.<br>B)not
Q8: Effector molecules<br>A)are associated with the induction of
Q9: In eukaryotes,gene amplification is _ and may
Q10: You are studying a biochemical pathway.Preliminary results
Q11: Cloning eukaryotic organisms involves the transfer of