Multiple Choice
The graph below shows which of the following? 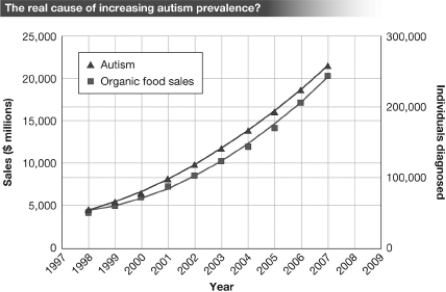
A) There is a strong correlation between the sale/consumption of organic food and the number of individuals diagnosed with autism between 1998 and 2007.
B) The increased consumption of organic food has led to an increase in the rate of autism between 1998 and 2007.
C) Consuming organic food causes autism.
D) There is strong evidence that a cause-effect relationship exists between the consumption of organic food and the development of autism.
Correct Answer:

Verified
Correct Answer:
Verified
Q4: The federally funded Centers for Disease Control
Q5: Cheryl searches the Internet for information regarding
Q17: Scientific studies that compare patients with a
Q19: Your best friend,Joe,is selling a new apparatus
Q30: The graph below shows that after the
Q44: You are reading a paper in the
Q53: When Anna Eaton was deciding whether to
Q65: A popular post on the Internet states
Q66: A large biotech company would like to
Q76: Rick has high blood pressure and decides