Multiple Choice
The figure below,based on data collected by The National Institute of Allergy and Infectious Diseases,graphically illustrates that a disease is less likely to spread to vulnerable members of a population if most of the population is immunized against the disease.This phenomenon occurs because 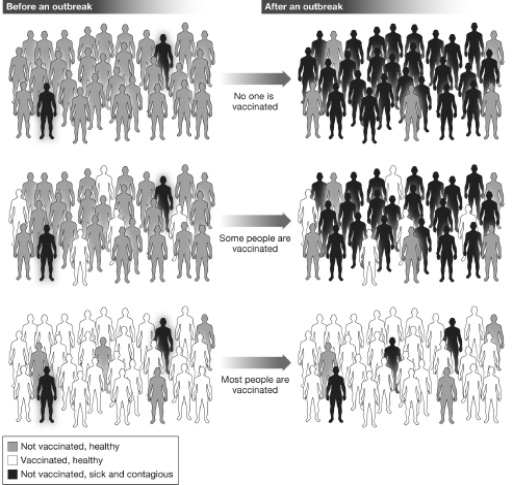
A) when fewer individuals in the population are likely to become infected,fewer people are able to spread the disease,and the vulnerable members of the population are less likely to come in contact with contagious individuals.
B) if more individuals in the population become infected,fewer people are able to spread the disease,and the vulnerable members of the population are less likely to come in contact with contagious individuals.
C) if more individuals in the population become infected,more people are able to spread the disease,and the vulnerable members of the population are less likely to come in contact with contagious individuals.
D) when none of the population is immune to the disease,no one will contract the disease and therefore pass it on to the vulnerable members of the population.
Correct Answer:

Verified
Correct Answer:
Verified
Q13: The graph below shows that post vaccination
Q39: An individual claims to be able to
Q41: A pharmaceutical company conducts trials on animals
Q60: Anna Eaton went to her local library
Q71: Announcing "scientific" findings in a press conference
Q73: Vaccines approved for use are continually monitored
Q82: Your own scientific literacy would NOT be
Q85: What is a first step an individual
Q86: When individuals use the scientific process to
Q90: Peer-reviewed scientific journals,technical reports,conference proceedings,and dissertations are