Short Answer
What kind of relationship is depicted in the following graph? 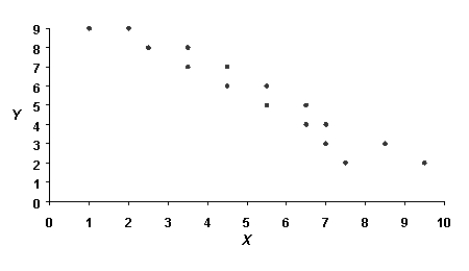
Correct Answer:

Verified
A negative...View Answer
Unlock this answer now
Get Access to more Verified Answers free of charge
Correct Answer:
Verified
A negative...
View Answer
Unlock this answer now
Get Access to more Verified Answers free of charge
Related Questions
Q12: The values of rho are<br>A)between -1 and
Q12: "The more you save,the less you spend"
Q14: Suppose you are trying to predict how
Q15: A U-shaped pattern is an example of
Q17: Suppose income and personal health are correlated
Q18: A linear regression procedure should ultimately yield
Q19: In a linear relationship,as the X scores
Q19: In general, a positive correlation means as
Q21: What does a correlation coefficient do?<br>A)It allows
Q48: "The bigger they are,the harder they fall"