Short Answer
What kind of relationship is depicted in the following graph? 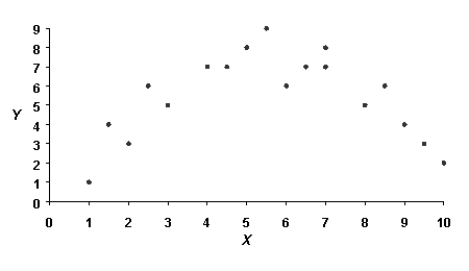
Correct Answer:

Verified
A nonlinea...View Answer
Unlock this answer now
Get Access to more Verified Answers free of charge
Correct Answer:
Verified
A nonlinea...
View Answer
Unlock this answer now
Get Access to more Verified Answers free of charge
Related Questions
Q18: When plotting correlational data,the appropriate graph to
Q24: What kind of relationship is depicted in
Q25: If you have a Pearson correlation coefficient
Q26: Use the following data set and
Q27: Suppose you've done a study and you're
Q28: The best-fitting line through a scatterplot is
Q30: We should do a scatterplot of the
Q31: In general, a zero correlation means<br>A)as the
Q32: What are the consequences of having a
Q33: What type of relationship does the following