Multiple Choice
The graph shows the decay rate R as a function of the time t for three radioactive samples.Rank the samples according to their half-lives, shortest to longest. 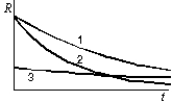
A) 1, 2 ,3
B) 1, 3, 2
C) 2, 1, 3
D) 2, 3, 1
E) 3, 1, 2
Correct Answer:

Verified
Correct Answer:
Verified
Related Questions
Q1: The model of the nucleus in which
Q2: The half-life of a given nuclear
Q4: Let A be the mass number and
Q5: Magnesium has atomic number 12, hydrogen
Q6: A radium atom, <sup>226</sup>Ra (Z = 86),
Q7: The half-life of a radioactive isotope is
Q8: A nucleus with mass number A and
Q9: The mass density of an atomic nucleus:<br>A)is
Q10: Some alpha emitters have longer half-lives than
Q11: The greatest binding energy per nucleon occurs