Multiple Choice
The energy level diagram shown applies to: 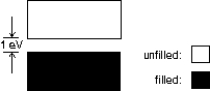
A) a conductor
B) an insulator
C) a semiconductor
D) an isolated molecule
E) an isolated atom
Correct Answer:

Verified
Correct Answer:
Verified
Related Questions
Q1: The Fermi-Dirac probability function P(E)varies between:<br>A)0 and
Q9: The energy gap between the valence and
Q11: A light emitting diode emits light when:<br>A)electrons
Q21: Compared to the number of conduction electrons
Q22: Compared to an insulator, the energy gap
Q26: A sinusoidal potential difference V<sub>in</sub> =
Q28: The density of states for a metal
Q34: When a forward bias is applied to
Q48: A certain material has a resistivity
Q51: For a pure semiconductor at room temperature