Multiple Choice
In the diagram, the function y(t) = ymsin( t) is plotted as a solid curve.The other three curves have the form y(t) = ymsin( t + ) , where is between - /2 and + /2.Rank the curves according to the value of , from the most negative to the most positive. 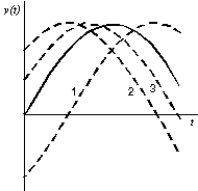
A) 1, 2, 3
B) 2, 3, 1
C) 3, 2, 1
D) 1, 3, 2
E) 2, 1, 3
Correct Answer:

Verified
Correct Answer:
Verified
Q1: A capacitor in an LC oscillator
Q12: In a purely capacitive circuit the current:<br>A)leads
Q21: A 35- <span class="ql-formula" data-value="\mu"><span class="katex"><span
Q24: An RL series circuit is connected to
Q25: The units of the power factor are:<br>A)ohm<br>B)watt<br>C)radian<br>D)ohm<sup>1/2</sup><br>E)none
Q26: An LC circuit has an inductance
Q57: An ac generator producing 10 V
Q79: A series circuit consists of a
Q86: An RLC series circuit, connected to
Q89: The electrical analog of a spring constant