Multiple Choice
This graph shows the angular position of an object as a function of time.What is its average angular velocity between t = 5 s and t = 9 s? 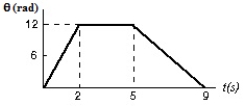
A) 3 rad/s
B) −3 rad/s
C) 12 rad/s
D) −12 rad/s
E) Need additional information.
Correct Answer:

Verified
Correct Answer:
Verified
Related Questions
Q5: A radian is about:<br>A)25 <span
Q11: This graph shows the angular position of
Q17: The figure shows forces acting on
Q49: A pulley with a radius of 3.0
Q51: One revolution is the same as:<br>A)"1
Q59: A child, riding on a large merry-go-round,
Q60: A car travels north at constant velocity.It
Q76: An 8.0-cm radius disk with a rotational
Q80: A constant torque of 260 N∙m acts
Q97: <img src="https://d2lvgg3v3hfg70.cloudfront.net/TB6585/.jpg" alt=" for an