Multiple Choice
The diagram shows a plot of the potential energy as a function of x for a particle moving along the x axis.The points of stable equilibrium are: 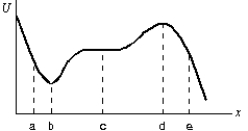
A) only a
B) only b
C) only c
D) only d
E) b and d
Correct Answer:

Verified
Correct Answer:
Verified
Related Questions
Q9: The graphs below show the magnitude of
Q10: The string in the figure is 50
Q11: The diagram shows a plot of the
Q12: A 0.50-kg block attached to an ideal
Q13: The potential energy of a particle moving
Q35: Two particles interact by conservative forces.In addition,
Q36: An elevator is rising at constant speed.Consider
Q47: A 6.0-kg block is released from rest
Q56: A 700-N man jumps out of a
Q59: A golf ball is struck by a