Multiple Choice
Use the information below to answer the following question(s) .Use the "Factors for Control Limits" Table A.3 from the textbook where required:
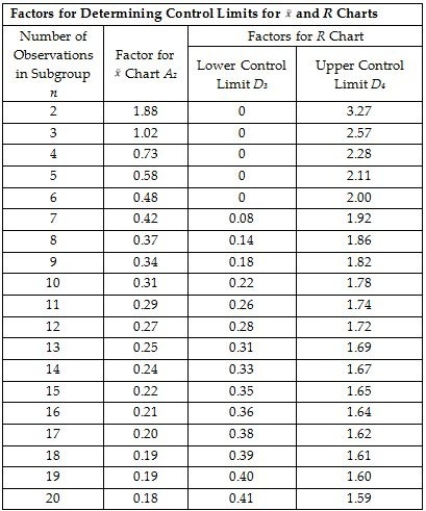 A control chart needs to be developed to determine if the temperature for a process is within control limits.Five samples each having 4 observations are taken and the sample measurements (temperature in degrees F) are noted in the table below:
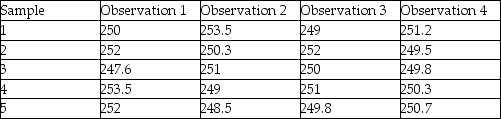
-What is the LCL for a X-bar chart?
A) 253.218
B) 247.852
C) 250
D) 252.527
Correct Answer:

Verified
Correct Answer:
Verified
Q9: The jump in sales of hand sanitizers
Q10: Five points in sequence,either above or below
Q11: A process which is in control is
Q12: Seven points in succession,all increasing or decreasing
Q13: Variation that results from a specific event,which
Q15: The control chart used to measure the
Q16: Use the information below to answer the
Q17: Variation that results from a specific event,which
Q18: A process that is stable has no
Q19: Concluding that a process is stable means