Multiple Choice
Use the information below to answer the following question(s) .Use the "Factors for Control Limits" Table A.3 from the textbook where required:
 A control chart needs to be developed to determine if the temperature for a process is within control limits.Five samples each having 4 observations are taken and the sample measurements (temperature in degrees F) are noted in the table below:
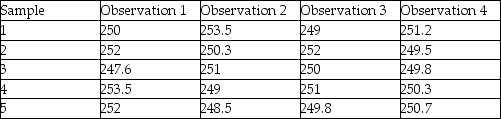
-What is the UCL for a R chart?
A) 3.68
B) 8.398
C) 3.125
D) 0
Correct Answer:

Verified
Correct Answer:
Verified
Q64: Fifty sample measurements of the length of
Q65: The ratio between the cost of inspection
Q66: Samples which are ordered by time or
Q67: On a control chart,one data point out
Q68: Use the information below to answer the
Q70: Every 10th product coming off a production
Q71: Data gathered to check if a process
Q72: The width of a distribution is called
Q73: For process control charts,using control limits corresponding
Q74: Aspects of the product that will result