Multiple Choice
Figure 15-3 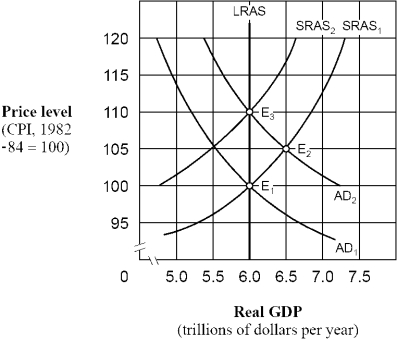
-As shown in Figure 15-3, if people behave according to adaptive expectations theory, an increase in the aggregate demand curve from AD1 to AD2 will cause the price level to move
A) directly from 100 to 110 and then remain at 110.
B) directly from 100 to 105 and then remain at 105.
C) from 100 to 105 initially and then eventually move back to 100.
D) from 100 to 105 initially and then eventually move to 110.
Correct Answer:

Verified
Correct Answer:
Verified
Q14: Under the adaptive expectations hypothesis, how will
Q20: Systematic overestimation or underestimation of inflation will<br>A)
Q23: According to the rational expectations theory,<br>A) on
Q36: The index of leading indicators was developed
Q77: Which combination of signals would be a
Q85: Which of the following contributed the most
Q89: What are the proper monetary and fiscal
Q96: Which of the following is a major
Q132: (I) Rational expectations adherents believe that decision makers
Q136: After an extended period of steady inflation