Multiple Choice
Use the figure below to answer the following question(s) .
Figure 10-7 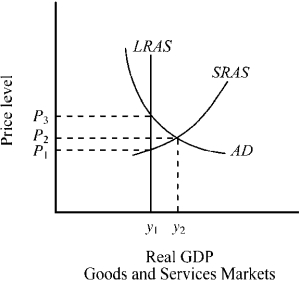
-Given the aggregate demand and aggregate supply curves for the economy depicted in Figure 10-7, the economy's output and price level are
A) output y1 and price level P1.
B) output y2 and price level P2
C) output y1 and price level P3.
D) output y2 and price level P1.
Correct Answer:

Verified
Correct Answer:
Verified
Q5: Which of the following is most likely
Q14: Suppose the economy is in long-run equilibrium.
Q51: Which of the following would be most
Q98: If there is an unanticipated decrease in
Q99: If the general level of prices is
Q112: Which of the following will most likely
Q139: If a market economy was in a
Q144: If business decision makers expect that the
Q152: An improvement in technology would shift which
Q177: Within the AD/AS model, how does an