Multiple Choice
Use the figure below to answer the following question(s) .
Figure 10-15 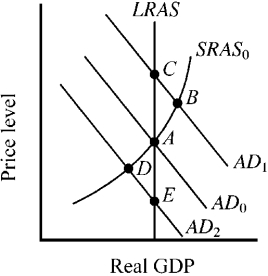
-The economy's short-run (SRAS ) and long-run (LRAS) aggregate supply curves are shown in Figure 10-15, along with three alternative aggregate demand curves and the accompanying equilibrium points. At which point will resource prices naturally tend to decrease?
A) A
B) B
C) C
D) D
Correct Answer:

Verified
Correct Answer:
Verified
Q2: Which of the following will most likely
Q62: Use the figure below to answer the
Q63: Which of the following will most likely
Q70: Which of the following would cause prices
Q88: Which of the following will most likely
Q119: If a reduction in stock prices reduces
Q127: Which will cause a larger short-run increase
Q129: The situation in which actual output exceeds
Q130: Which of the following would be most
Q160: A rise in the price of oil